Projected 65min VolumeThe script provides relative volume for the first 5min candle after its close vs 14 avg and estimates projected volume for the first 65min candle in the trading session vs avg value.
!!!The indicator is designed to work only at 5min TF!!!
Поиск скриптов по запросу "the script"

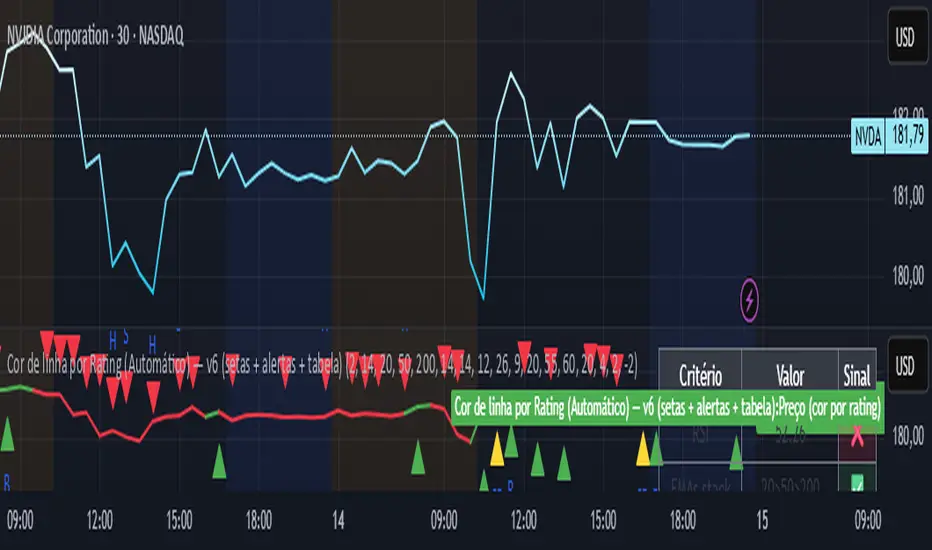
Line color best indices grouped by Artificial Intelligence
The script uses the best buy indicators, such as moving average crossovers, RSI, and others selected by AI. The idea is to determine whether the stock is classified as a strong buy (yellow line), a buy (green line), or a red (sell)
ATR Stop Loss Non-Decreasing & LineThe script calculates a custom stop-loss level based on the Average True Range (ATR) indicator, ensuring that this stop-loss level never decreases from one bar to the next unless a reset condition is met. It also visually displays the ATR value and the calculated stop-loss level as a line on the chart.

Adjustable Vertical LinesThe script provides an indicator which will plot lines - 15 min, 30 min and 60 min. You can customize the time intervals and go to as low as one minute, but I found the 15-minute and 30-minute intervals works best for me when trying to find setups, and the lower time-frame intervals, is just pointless to use if you're not scalping on the seconds timeframe.
You can customize inputs for the line style. Line thickness, colour, etc.
I've seen this work using the OBR theory and applying it to the one-minute candle then looking for other confluences like order blocks, or breakers, FVGs, BOS/CHoC for further confirmation for scalping. It's important to backtest though and see for yourself.
Thanks for the boost.

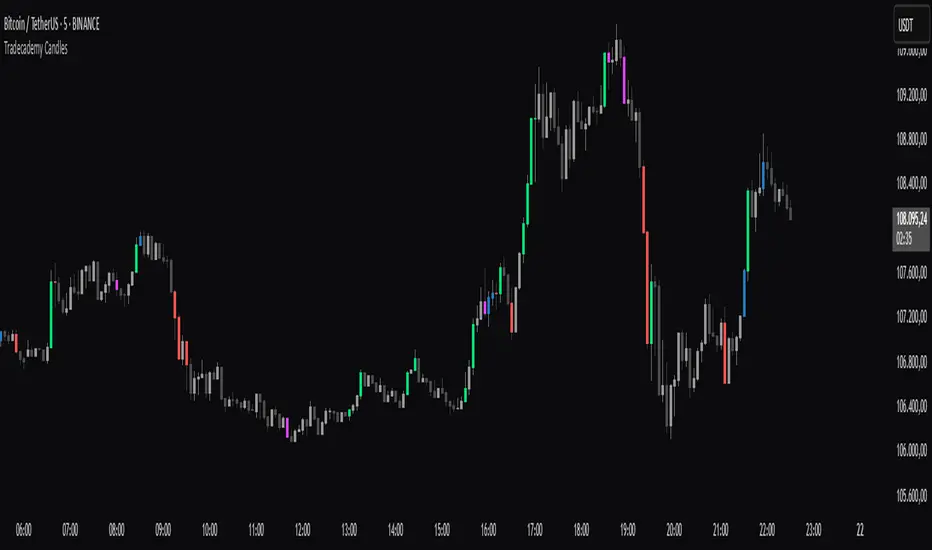
Tradecademy CandlesThe script highlights high-volume candles .
Upward candles with significantly increased volume = green
Upward candles with moderately increased volume = blue
Downward candles with significantly increased volume = red
Downward candles with moderately increased volume = pink
Global M2 YoY % Increase signalThe script produces a signal each time the global M2 increases more than 2.5%. This usually coincides with bitcoin prices pumps, except when it is late in the business cycle or the bitcoin price / halving cycle.
It leverages dylanleclair Global M2 YoY % change, with several modifications:
adding a 10 week lead at the YoY Change plot for better visibility, so that the bitcoin pump moreless coincides with the YoY change.
signal increases > 2.5 in Global M2 at the point at which they occur with a green triangle up.

Wick Order IndicatorThe script tells you what formed first in the wick, the high or the low.
If the high formed first, the upper wick would be labeled 1 and lower wick would be labeled 2.
If the low formed first, the lower wick would be labeled 1 and higher wick would be labeled 2.
If there's only one wick or no wicks, there would be no labels.

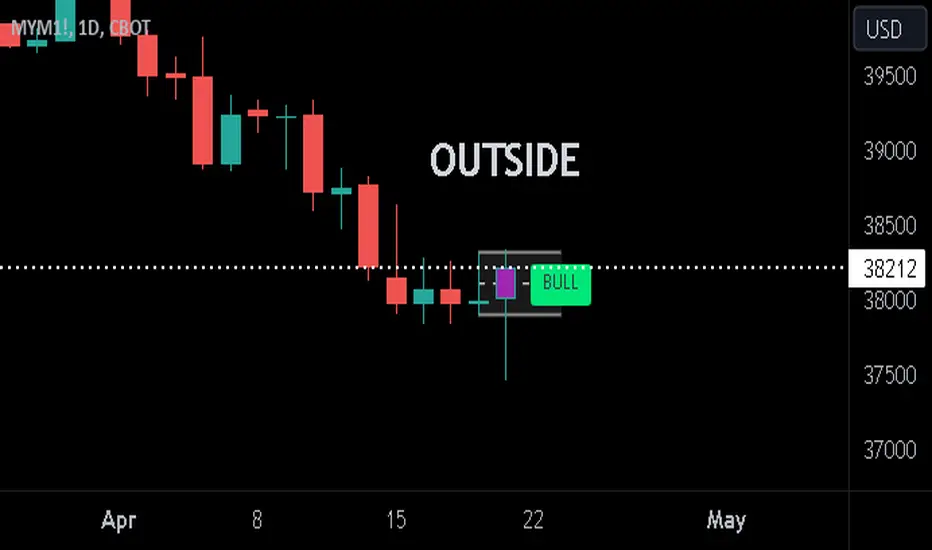
Previous Candle + Inside/OutsideThe script uses the previous candle of the current timeframe to assess the state of the current candle.
1. Previous candle high/low and midpoint are displayed
2. Highlights current bar if INSIDE previous candle
3. Highlights current bar if POTENTIAL OUTSIDE bar. This condition uses the logic that if the previous high/low has been swept and price then reaches previous bar 50%, then an OUTSIDE bar is possible.
4. If current candle breaks previous high/low, a label is added to identify.
5. If above condition is true and current candle color is opposite of previous, then label is highlighted to show possible bull/bear condition.
6. If current candle live price is below previous midpoint, a BEAR label is shown
7. If current candle live price is above previous midpoint, a BULL label is shown
I personally use the indicator on Daily/Weekly/Monthly charts to help with my overall market assessment. However users may find their own use for the indicator...or modify it to their own preferences.
As ever, the indicator should only be used with live trading accounts after thorough backtesting using a large data range.
Logarithmic Bollinger Bands [MisterMoTA]The script plot the normal top and bottom Bollinger Bands and from them and SMA 20 it finds fibonacci logarithmic levels where price can find temporary support/resistance.
To get the best results need to change the standard deviation to your simbol value, like current for BTC the Standards Deviation is 2.61, current Standard Deviation for ETH is 2.55.. etc.. find the right current standard deviation of your simbol with a search online.
The lines ploted by indicators are:
Main line is a 20 SMA
2 retracement Logarithmic Fibonacci 0.382 levels above and bellow 20 sma
2 retracement Logarithmic Fibonacci 0.618 levels above and bellow 20 sma
Top and Bottom Bollindger bands (ticker than the rest of the lines)
2 expansion Logarithmic Fibonacci 0.382 levels above Top BB and bellow Bottom BB
2 expansion Logarithmic Fibonacci 0.618 levels above Top BB and bellow Bottom BB
2 expansion Logarithmic Fibonacci level 1 above Top BB and bellow Bottom BB
2 expansion Logarithmic Fibonacci 1.618 levels above Top BB and bellow Bottom BB
Let me know If you find the indicator useful or PM if you need any custom changes to it.

Show-BiasThe script looks at the current bar and prints the bullishness or bearishness bias based on the high, low and close values.
Bullish bias:
----------------
Higher High
Higher Low
Higher Close
Green candle
Bearish bias:
----------------
Lower High
Lower Low
Lower Close
Red candle

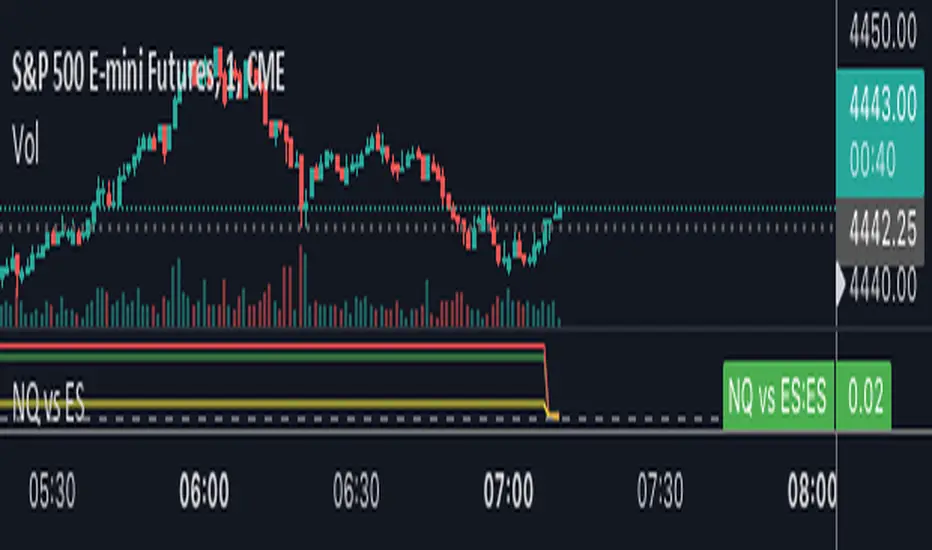
NQ vs ESThe script shows the spread between the realtime NQ and ES percentage change from the day before, from which it is possible to see if NQ is outperforming or underperforming the ES.
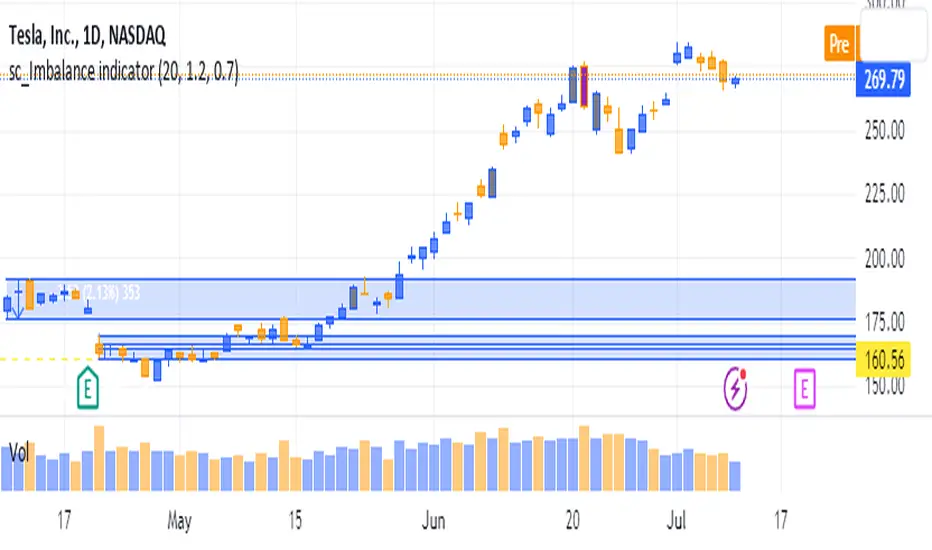
sc_Imbalance indicatorThe script helps to identify imbalance trade candles on the chart.
Prices after a rip-up candle (color in gray, default) will often see subsequent prices backfilling the rip-up candle ie. prices after the rip-up imbalance will fall back down. The opposite is true for flush-down candles (color in purple, default). This indicator allows a quick seeing of which imbalance candle that not been backfilled yet and present opportunities in trading the stock with potential target price based on the imbalance candle.
[TT] Sectors Dist % From MA- The script shows the distance in percentages from the 200 MA (or any other MA period) , for the 11 SP500 sectors.
- It works based on the current time frames.
Could be useful when working with mean reversion strategies to detect extremes zones and overbought/oversold conditions in the given sectors compared others.

US Fed Rate Hike Historical DatesThe script applies Blue (color can be changed) highlights to the days that the US Federal Reserve Hiked interest rates. Data goes back to the 60's. This can be applied to any chart/timeframe to view how the asset behaved before/during/after Federal Rate Hikes.
****This was updated as of Dec 2022... Any decisions after Dec 2022 will not show up in this indicator.
Versions may be updated periodically to include new data.
Hope this helps. Happy Trades
-SnarkyPuppy

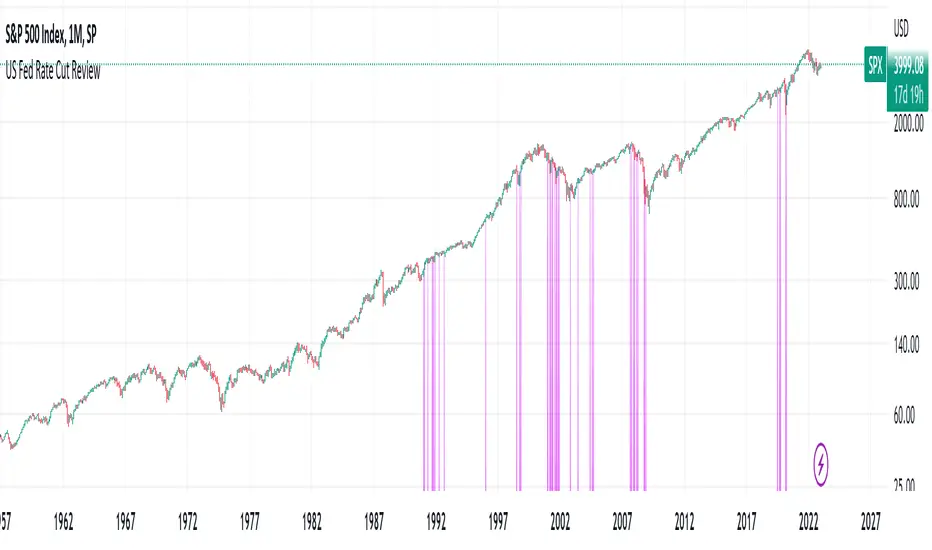
US Fed Rate Cut Historical DatesThe script applies Purple (color can be changed) highlights to the days that the US Federal Reserve Cut interest rates. Data goes back to the 60's. This can be applied to any chart/timeframe to view how the asset behaved before/during/after Federal Rate cuts.
****This was updated as of Dec 2022... Any decisions after Dec 2022 will not show up in this indicator.
Versions may be updated periodically to include new data.
Hope this helps. Happy Trades
-SnarkyPuppy
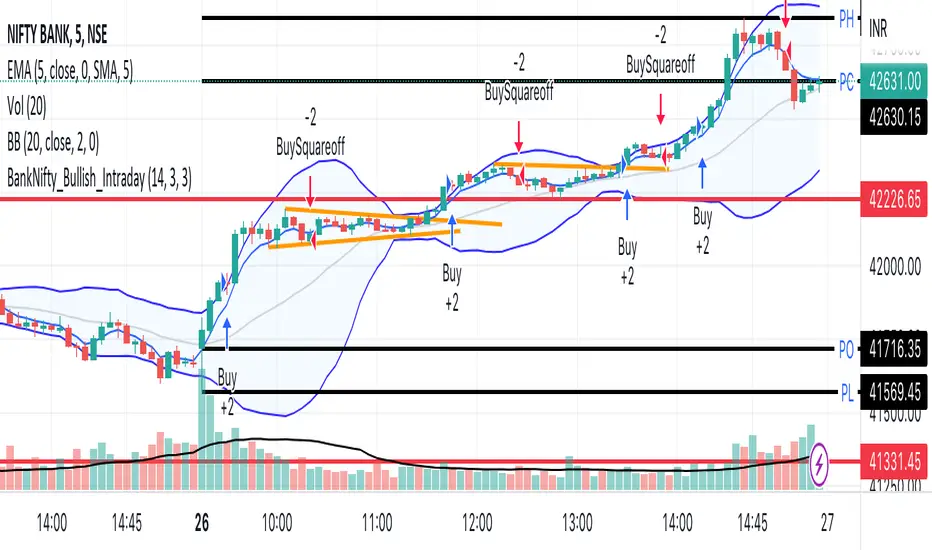
BankNifty_Bullish_Intraday
The script uses following mechanism to give a signal of BUY if multiple parameters evaluated are all passed.
ENTRY-
1. 5 min MACD should be more than its previous tick
2. 15 min MACD should be more than its previous tick
3. 60 min MACD should be more than its previous tick
4. ADX should be more than 12
5. RSI should be more than 60
6. Stochastic %k should have cross over with %d
7. Bollinger band upper band value should be more than previous tick
EXIT
If the 5 min bar price closes below 5 min EMA , it gives an exit signal.
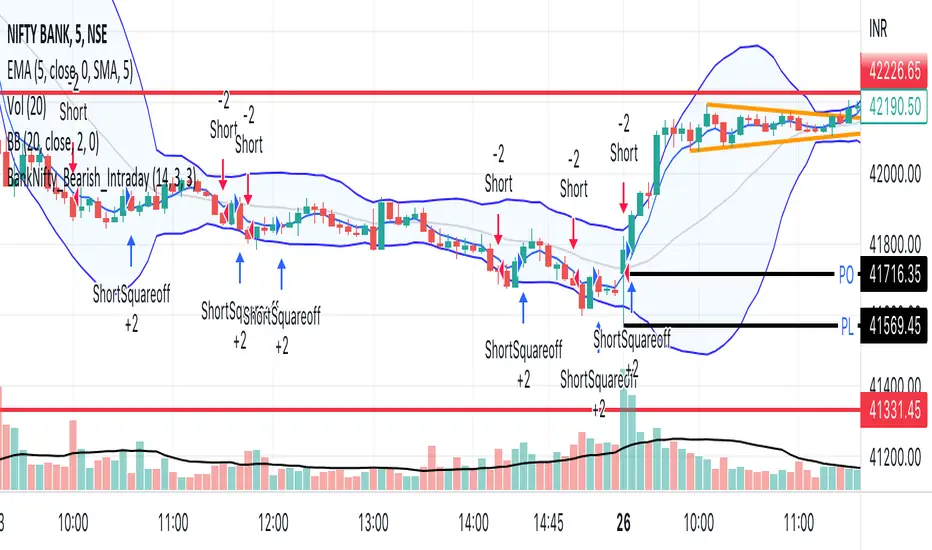
BankNifty_Bearish_Intraday
The script uses following mechanism to give a signal of SELL if multiple parameters evaluated are all passed.
ENTRY-
1. 5 min MACD should be less than its previous tick
2. 15 min MACD should be less than its previous tick
3. 60 min MACD should be less than its previous tick
4. ADX should be more than 12
5. RSI should be less than 40
6. Stochastic %k should have negative cross over with %d
7. Bollinger band lower band value should be less than previous tick
EXIT
If the 5 min bar price closes above 5 min EMA , it gives an exit signal.
ATR Trend FollowingThe script filters stocks on the basis of ATR. If the stock has moved above 7 times the ATR from the lows, the system generates buy signal and continues till the stock drops by 2 ATR. It is a good system in trending markets however in sideways consolidating markets, the system must be avoided. In trending markets it can generate good returns with significant Risk to Reward Ratio. Use it in confirmation with other trend depicting indicators is expected to generate better results.

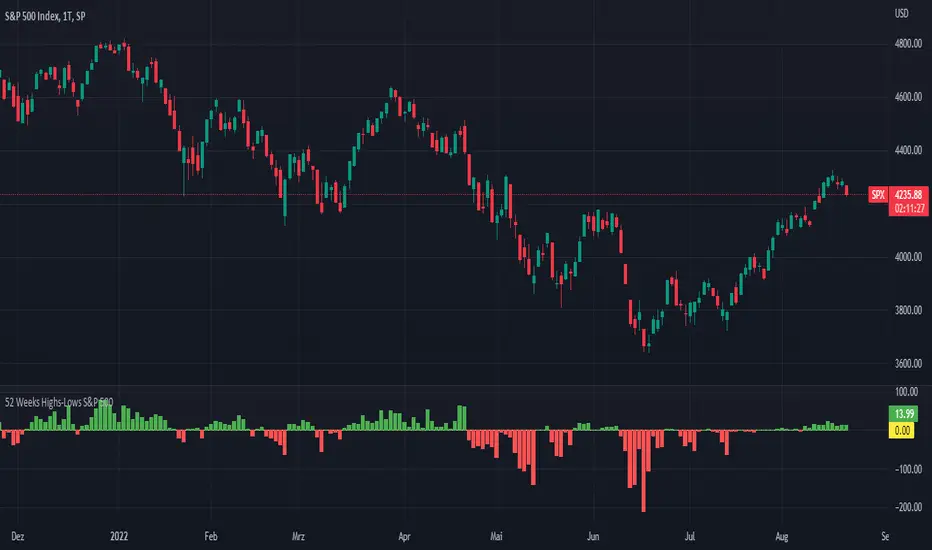
52 Weeks Highs-Lows S&P 500 - MugurThe script uses the MAHP and the MALP index and subtracts the second from the first. So you can see how many stocks in the S&P 500 make new highs or new lows on a 52 weeks basis and see the trend of the market.
5 Day Highs-Lows S&P 500 - MugurThe script uses the M5HP and the M5LP index and subtracts the second from the first. So you can see how many stocks in the S&P 500 make new highs or new lows on a 5 days basis and see the trend of the market.

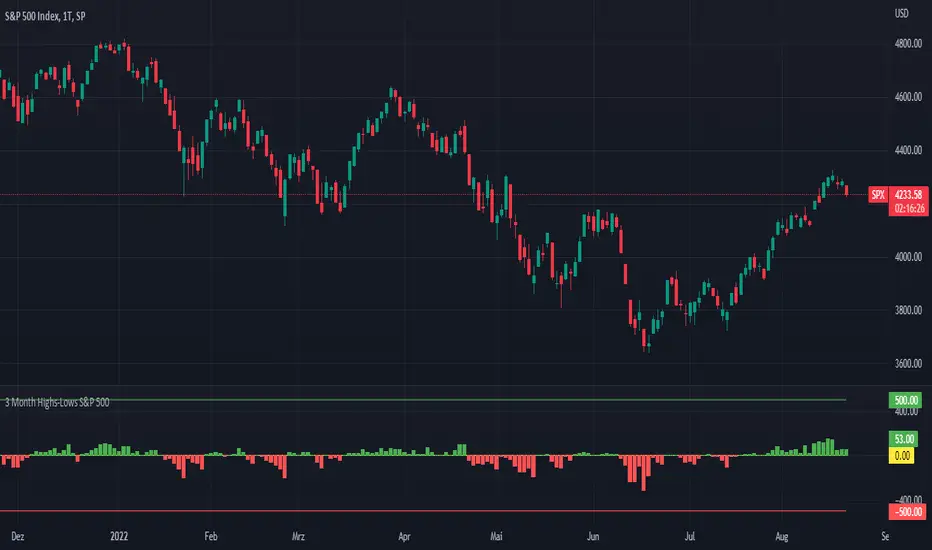
3 Month Highs-Lows S&P 500 - MugurThe script uses the M3HP and the M3LP index and subtracts the second from the first. So you can see how many stocks in the S&P 500 make new highs or new lows on a 3 month basis and see the trend of the market.
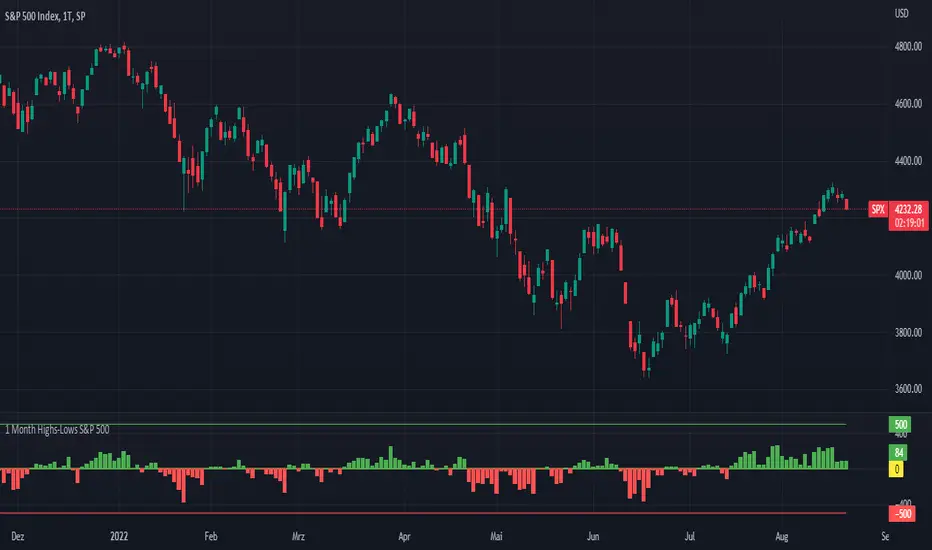
1 Month Highs-Lows S&P 500 - MugurThe script uses the M1HP and the M1LP index and subtracts the second from the first. So you can see how many stocks in the S&P 500 make new highs or new lows on a 1 month basis and see the trend of the market.
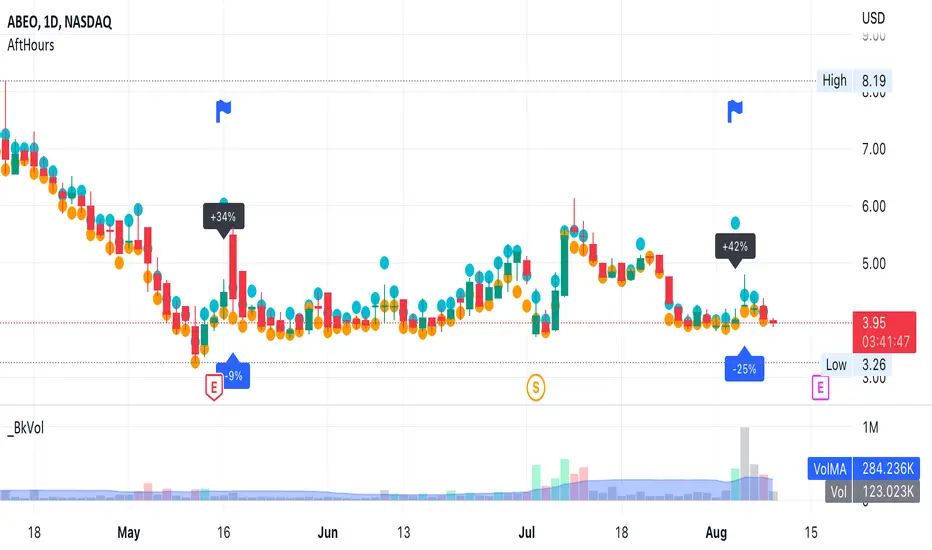
AfterHours Spike DetectorThe script pulls Lower Timeframe (30min) data to draw High/Low of Out-of-hours/AfterHours session (post-market session & next day pre-market session) on the Daily regular session chart. It then identifies significant AfterHours price changes and what happens to these price Spikes by the Open of the next day regular session.
You can change:
wether to show AfterHours High/Lows
wether to show AfterHours price Spikes
the AfterHours price Spike threshold (default = +/- 10%)